Is a 22% increase in views week to week good, bad or ??7664
Pages:
1

|
sbl110 private msg quote post Address this user | |
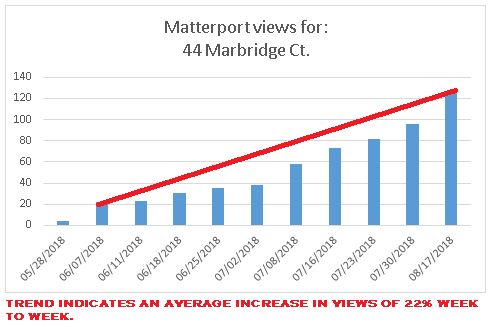
| Hi Everyone, Just lost a client because in their words "the counts were too low." Let me put this in perspective, so please bear with me. First, this client is new to Matterport. Their parent company recommended that they try Matterport. I've done three shoots, all high-end homes. One however seemed to disappear from the market about a week or two after the shoot. I inquired, but my client didn't reply. So technically they have only used two Matterport tours. My terms are to host for 90 days free, then I charge $15.00/quarter to continue hosting. I feel this "maintenance" fee is minimal and acceptable. Comments welcome. I know some MSP's host for a year. Ok, moving on. I send a friendly email explaining that one space is past it's 90 day mark and that to continue I charge $15.00/quarter to continue. This was explained when we first met, it's on my website and it's spelled out on my invoice. The reply was "we had no idea that it would cost $5.00/month to continue the hosting." Then goes on to say that the counts are low and they will let me know if they want my services again. So they didn't pay attention to details and they think $5.00/month is too much to maintain hosting for a home selling for $2.2 million dollars! I supply weekly stats (provided from Matterport) and have suggested that they can improve the numbers by using social media, email blasts, brochures, etc. Apparently they believe that having a Matterport 3D tour is magical and will sell a house without any marketing effort. Honestly, would you have something as simple as a garage sale and not advertise? Sorry, I'm venting and still a bit perturbed over this. The stats were going in the right direction, even without any extra effort on their part. Here's a graph showing the trend:  And while I'm no genius, I would imagine that million dollar plus homes don't sell at a break neck pace. It takes time, and the agent needs to make an effort to promote the fact that they use Matterport. So does anyone track trends? In other words, do you monitor stats and share the trends with your clients. Do you consider a 22% increase week to week in viewings a failure? Thanks for enduring this rather long rant to get to a basic question -- but like every story, it requires context. Scott |
||
| Post 1 • IP flag post | ||

|
JonJ private msg quote post Address this user | |
| Hi Sbl110, Forgive me, but looking at your graph, is this a plot showing the number of views for the week, or the lifetime views reported each week? Thank you, Jon J |
||
| Post 2 • IP flag post | ||

|
sbl110 private msg quote post Address this user | |
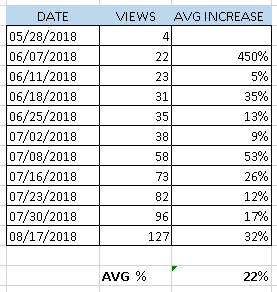
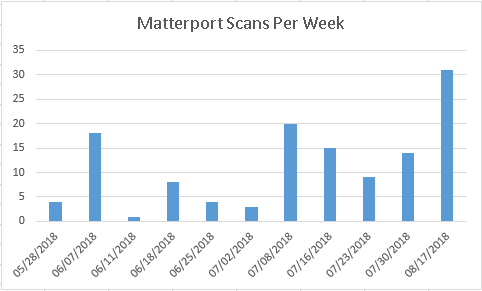
| Hi Jon J, The graph represents accumulated totals from 05/28 to 08/17. I calculated the percent of increase from week to week to plot the graph. Here's the raw data:  I threw out the second weeks totals because I thought it would make the average of 61% unrealistic. When I submitted stats, I just created a spreadsheet that tracked the numbers from week to week. Now that I think of it, a graph would be more appealing -- and show a positive track without concentrating too much on the numbers. Honestly, I'm not sure anything would have satisfied this client. Does that answer your question? Just for the record, I wanted to show percent of growth, not each week individually. If I showed each weeks totals, the graph would look like this:  Not as visually appealing as the percentage increase. Same numbers, just displayed differently. Scott |
||
| Post 3 • IP flag post | ||

|
jblythe private msg quote post Address this user | |
| @sbl110 I am no expert here and cannot provide any advice on whether or not to provide such numbers, but, numbers like this are something that I do a ton of in my regular job. I think you are right, multi-million dollar homes probably do not sell at a break neck pace, and I dont know what the "usual" number of viewings should be for this type of listing. What I do see though is that averaging a percentage is generally a bad idea when showing growth (and in general). One thing I noticed is the 17 day gap in your last figure. If you took that 31 view increase and made it more like the week over week you are describing, you are getting and average of 20ish percent, basically adding 1 additional measurement period into the calculation. You can see how one offset of a number can make a big difference in an average, especially with a low denominator. This could further change if shorter periods are added for measurement (2-3 day periods for example). Another, more difficult thing, is that not all of the offsets are 7 days, so this cant truly be a week over week representation. (Most of them are. This wasnt meant as a degradation of the information, just simply a callout of the observation) I think the second graph you provided gives a more accurate representation of the "activity" on the listing and might be a better thing to show... this might be where they had the idea of "the counts are too low". One thing that might help is showing an average daily views over each period (timeframe views/days in timeframe) and plotting those to get an idea of average activity. Then you could show a true average (total views/total days) and use that as a measurement going forward. This might actually be pretty powerful if you have a decent set of data. You could say things like "Typically, with houses in this area, we see sales in about X days when the average views are Y". You could also further this when that number starts to drop by adding in the marketing aspect you mentioned..saying something like "we normally see an average daily views in the X range when you market on social media, email blasts, etc". Again, I am only providing insight with what I see. Maybe others have ideas on what "normal" is but I am sure this varies by market, price, etc. |
||
| Post 4 • IP flag post | ||

|
sbl110 private msg quote post Address this user | |
| Hi @jblythe, Thanks for the honest reply. Since views are not under my control, I was hesitant to even provide any because I knew that initially they would be low. I encouraged the client to use social media, and other avenues to bolster awareness, but in the end, I guess they thought it was too much work. Even trying to get basic feedback was nearly impossible. Perhaps loosing them is a good thing in the long run because with each failure, I learn something valuable. I'll definitely consider using a different graph if clients ask for view stats. Thanks again. Scott |
||
| Post 5 • IP flag post | ||

|
jblythe private msg quote post Address this user | |
| @sbl110 No problem, and happy to help! All we can ever do in a customer service oriented space is supply the client with the information they ask for. I agree every opportunity, good or bad, is a learning opportunity and what we do with that is up to us. I think there really is some value in the information you are able to provide, figuring out the "how" is always the tough part jason |
||
| Post 6 • IP flag post | ||
Pages:
1This topic is archived. Start new topic?


