Realtor.com: 43.1% Fewer Homes for Sale versus 2020; but More Than May 202115185
Pages:
1
 WGAN Forum WGAN ForumFounder & WGAN-TV Podcast Host Atlanta, Georgia |
DanSmigrod private msg quote post Address this user | |
| Media Release --- 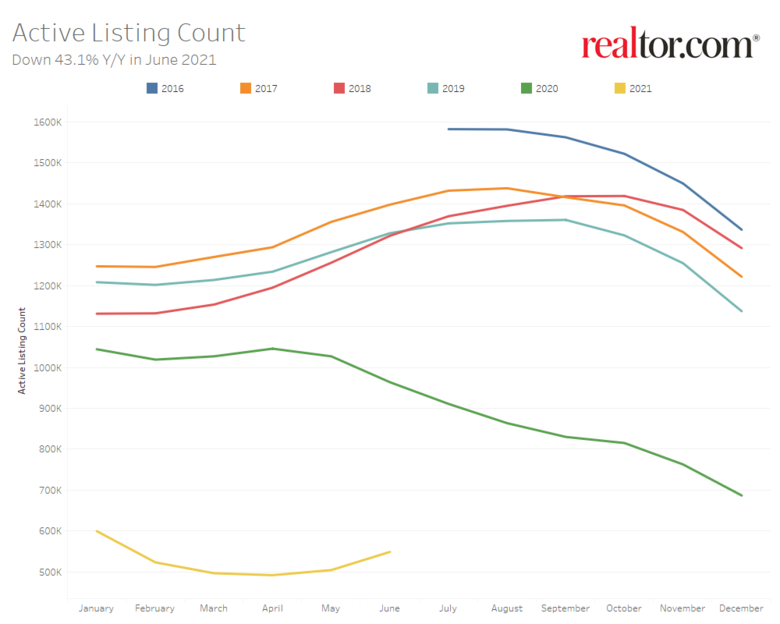 Chart 1 | Courtesy of Realtor.com 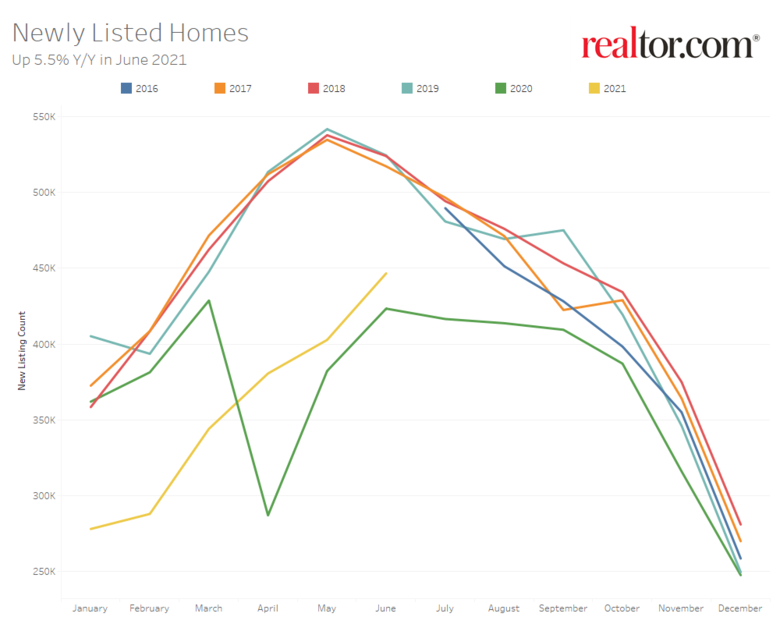 Chart 2 | Courtesy of Realtor.com 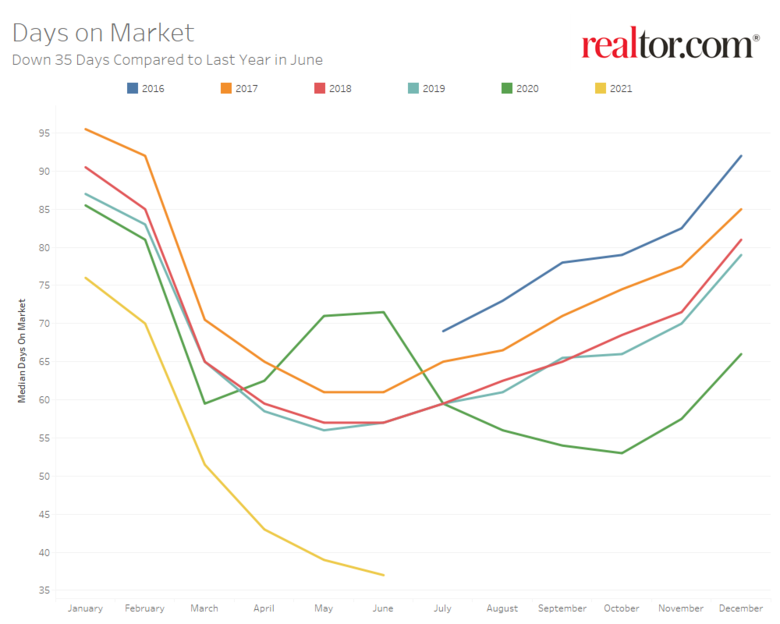 Chart 3 | Courtesy of Realtor.com Realtor.com® Housing Report: New Listings Stage a Comeback in June as Home Prices Hit a New High Top markets for new listings growth include: Milwaukee (+44.7%), San Jose (+40.7%), and Cleveland (37.9%) - In June, U.S. new listings increased 10.9% over May and 5.5% year-over-year - The U.S. median listing price increased 12.7% year-over-year to a new all-time high of $385,000 - There were 43.1% fewer homes for sale in June compared to last year, an improvement from a 50.9% year-over-year decline in May - The typical home sold in 37 days, 35 days faster than last year SANTA CLARA, Calif., July 1, 2021 /PRNewswire/ -- New listings showed signs of a comeback in June as home prices broke a new record for the fifth month in a row at $385,000, according to the Realtor.com® Monthly Housing Report released today. While the number of homes for sale remained drastically lower than normal with a 43.1% decline over last year, June marks a significant improvement over last month's 50.9% decline. "Although there's still a significant shortage of homes for sale and home prices just hit a new high, our June data report shows good news on the horizon for buyers," said Realtor.com® Senior Economist George Ratiu. "Inventory declines improved over the steep drops seen earlier in the pandemic as sellers stepped back into the market in a variety of price ranges across the country. The improvement we saw in new listings growth from May to June shows sellers are entering the market historically later in the season, which could mean we'll see home buying continue into the fall as buyers jump at new opportunities." According to the Realtor.com® data, June new listings increased 5.5% year-over-year and 10.9% over last month. Among the largest U.S. metros, the 10 markets with the highest new listings increases posted gains of 20% or more year-over-year. Although there were fewer homes actively for sale on a typical day in June compared to last year and to the average June from 2017-2019, the uptick in newly-listed homes may be giving buyers more homes to choose from and potentially more time to make decisions. If these trends persist, inventory declines and price growth may continue to moderate as the housing market returns to a more normal pace of activity heading into the second half of 2021, Ratiu said. Inventory declines continue to slow as new listings diverge from typical summer trend U.S. inventory was down 43.1% year-over-year last month, representing 415,000 fewer homes for sale on a typical day in June compared to the same time last year, but an improvement over the more than 50% year-over-year declines seen in March, April and May. While more sellers entered the market in June compared to last year, new listings growth was still 14.4% below the average of the June levels seen from 2017 to 2019. Compared to the national rate in June, inventory took bigger steps towards recovery in the 50 largest metros, declining 40.5% year-over-year as big city sellers added 11.7% more listings to the market. New listings were up over 20% year-over-year in the 10 metros that saw the biggest gains, including Milwaukee (+44.7%), San Jose (+40.7%), and Cleveland (37.9%). Listing prices reach latest new high as growth moderates In June, the median U.S. listing price grew 12.7% over last year to $385,000, marking the fifth straight month of record-high prices seen according to Realtor.com® data, which dates back to 2012. However, the year-over-year pace of price growth moderated for the second consecutive month in June, down from 15.2% in May. Listing price growth in the biggest U.S. metros is moderating more quickly than the national pace, increasing 5.3% year-over-year in June, below the growth levels seen in May (+7.4%) and April (+11.6%). Among the nation's 50 largest markets, Austin, Texas continued its 2021 streak of taking the top spot by price growth, up 34.3% year-over-year. Riverside, Calif., and Tampa also saw some of the biggest price gains over last year, with each rising by 19.6%. Homes continue to fly off the market as buyers compete for inventory The typical home spent 37 days on the market in June, 35 days faster than last year and 21 days faster than the average time on market from 2017, 2018 and 2019, a more normal market. Denver and Rochester tied for the fastest time on market in June at a median 12 days, followed by Nashville (15 days). Homes sold even faster in the 50 largest U.S. metros, spending an average of 31 days on market and down 23 days year-over-year. Big cities that saw the biggest declines in days on market were Miami (-52 days), Raleigh (-48 days), and Pittsburgh (-48 days). June 2021 Housing Overview by Top 50 Largest Metros 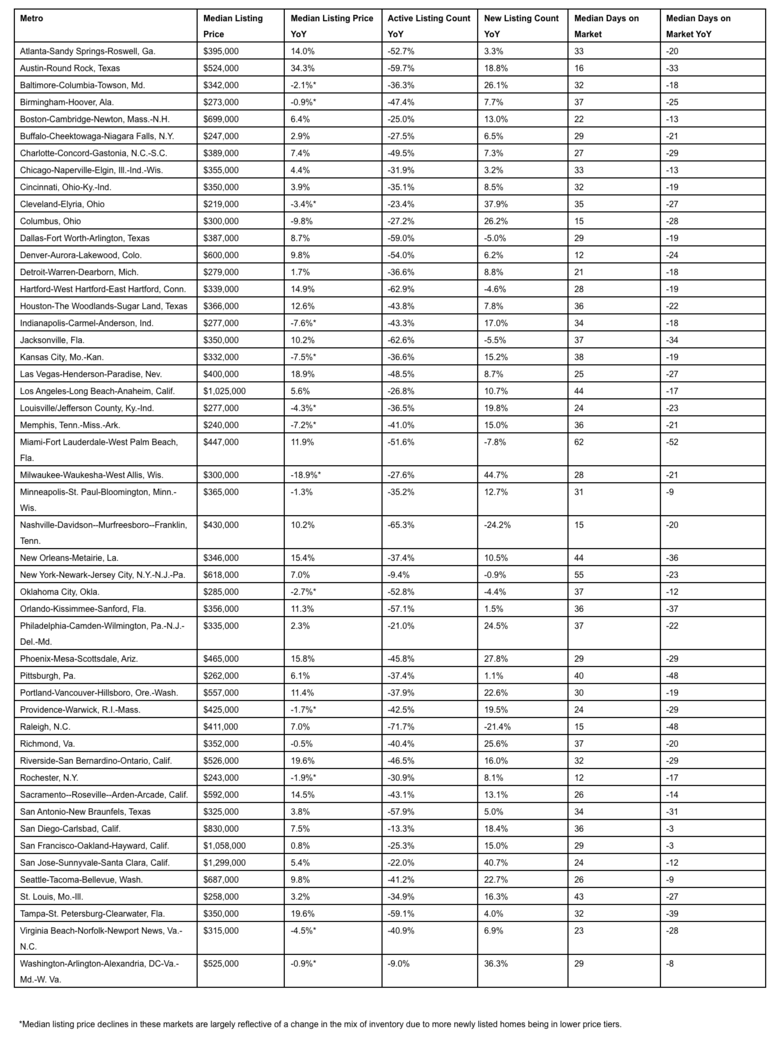 Source: Realtor.com® About Realtor.com® Realtor.com® makes buying, selling, renting and living in homes easier and more rewarding for everyone. Realtor.com® pioneered the world of digital real estate more than 20 years ago, and today through its website and mobile apps is a trusted source for the information, tools and professional expertise that help people move confidently through every step of their home journey. Using proprietary data science and machine learning technology, Realtor.com® pairs buyers and sellers with local agents in their market, helping take the guesswork out of buying and selling a home. For professionals, Realtor.com® is a trusted provider of consumer connections and branding solutions that help them succeed in today's on-demand world. Realtor.com® is operated by News Corp [Nasdaq: NWS, NWSA] [ASX: NWS, NWSLV] subsidiary Move, Inc. under a perpetual license from the National Association of REALTORS®. For more information, visit Realtor.com®. Source: Realtor.com via PRNewswire |
||
| Post 1 • IP flag post | ||
Pages:
1This topic is archived. Start new topic?

